


End-to-End Visibility for OpenText
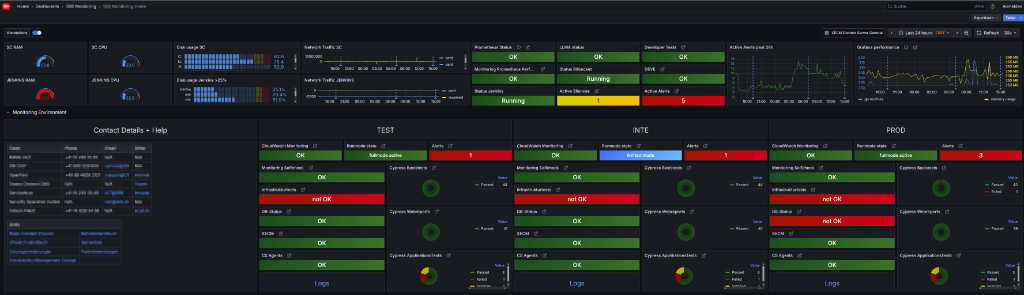
Stop fighting fires and start preventing them. The Monitoring Home dashboard gives you a live pulse of your entire OpenText ecosystem. See immediately if your TEST, INTE, and PROD environments are healthy, and identify resource bottlenecks before users complain.
Resource Tracking
Monitor CPU and RAM across critical components like SC and Jenkins.
Alert Aggregation
Active silences and Prometheus alerts summarized in one intuitive view.
Environment Status
Instant red/green indicators for DB status, infrastructure tests, and runmodes.
The Bottom Line: Proactive Management
By consolidating all critical OpenText metrics into a single pane of glass, your team saves hours of manual checking every week. Transition from reactive firefighting to proactive management, reducing MTTR and boosting system availability.
Granular Infrastructure Insights
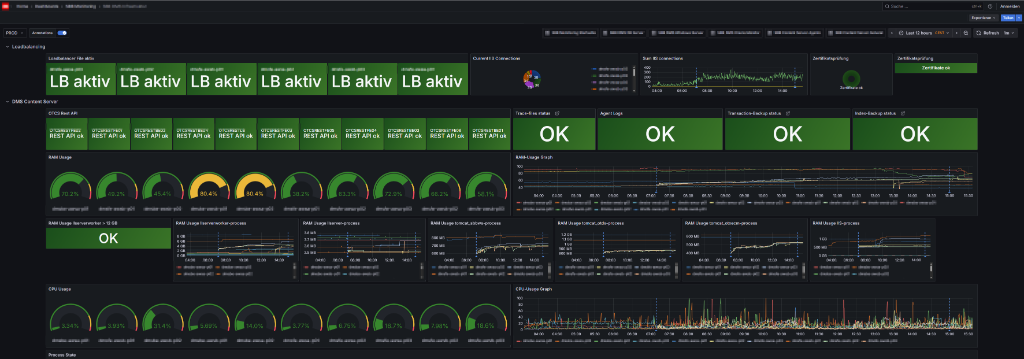
Don't let a single failing node bring down your platform. Dive deep into your server infrastructure to ensure load balancing is active and resources are distributed perfectly.
Load Balancing Health
Verify active load balancer nodes in real-time.
Node-Level Metrics
Identify CPU and RAM spikes on specific servers instantly.
Capacity Planning
Use hardware utilization data to plan upgrades before you hit limits.
The Bottom Line: Uninterrupted Operations
Prevent localized node failures from causing system-wide outages. With real-time visibility into your infrastructure layer, you can redistribute load instantly and ensure that your OpenText platform remains resilient under heavy usage.
Oracle Database Deep Dive
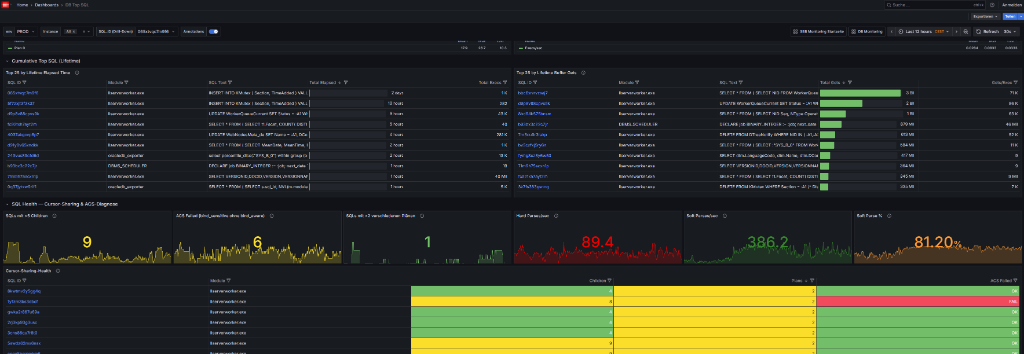
The database is the heart of OpenText. Our AWR integration decodes complex Oracle metrics into actionable insights, helping you eliminate slow queries and optimize performance.
Top SQL Queries
Identify queries consuming the most elapsed time and buffer gets.
Parse Analysis
Monitor hard and soft parse percentages to optimize database CPU.
Session Tracking
Spot failed ACS and active sessions instantly to prevent deadlocks.
The Bottom Line: Blazing Fast Queries
A sluggish database means a sluggish ECM. By exposing the exact SQL queries causing bottlenecks, you empower your DBAs to optimize performance precisely where it matters, ensuring lightning-fast search and retrieval times for your end users.
Master Your AWS Cloud Environment
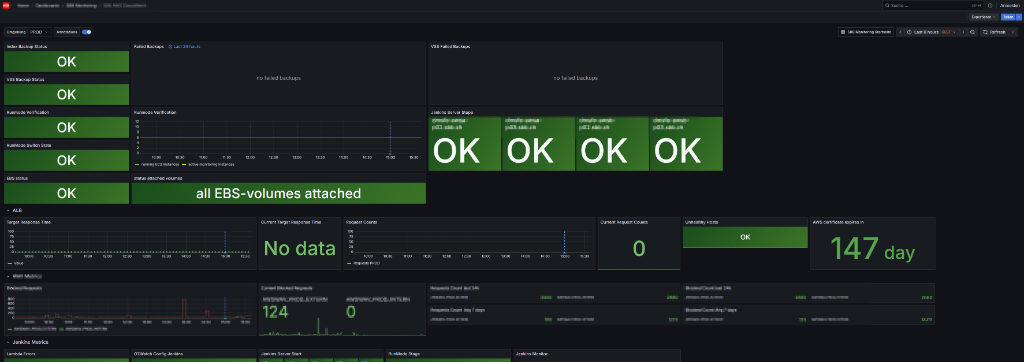
Running OpenText in the cloud requires specialized oversight. OTWATCH natively integrates with AWS CloudWatch to monitor your backups, load balancers, and certificates.
Backup Assurance
Never miss a failed VSS or Index backup again with live status tracking.
ALB Traffic
Monitor Application Load Balancer request counts and response times.
Security & Compliance
Track SSL certificate expiration dates to prevent sudden outages.
The Bottom Line: Cloud Confidence
Ensure absolute data integrity and regulatory compliance in the cloud. With automated monitoring of AWS backups and SSL certificates, you eliminate the risk of silent failures and avoid catastrophic data loss or sudden security outages.
Master Your Content Server Agents
Track the heartbeat of your OpenText background processes. Ensure distributed agents, admin servers, and indexing partitions are running smoothly without bottlenecks.
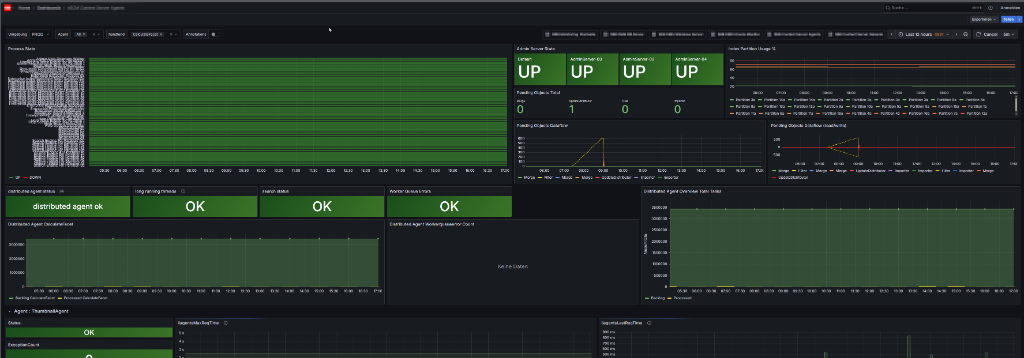
Agent Health Monitoring
Verify the state of distributed agents, long-running threads, and admin servers at a glance.
Queue & Object Tracking
Monitor pending objects totals and dataflows to prevent processing backlogs.
Index Partition Insights
Track index partition usage percentages to proactively manage search capabilities.
The Bottom Line: Smooth Background Operations
Background agents are the invisible engine of OpenText. By monitoring their queues and states in real-time, you prevent silent failures that can paralyze your document processing pipelines, ensuring your users always have up-to-date search results and workflows.
Uncover Thread-Level Bottlenecks
Dive deep into the execution threads of your Content Server. Identify slow-running threads, track active thread counts across clusters, and monitor execution times to ensure maximum responsiveness.
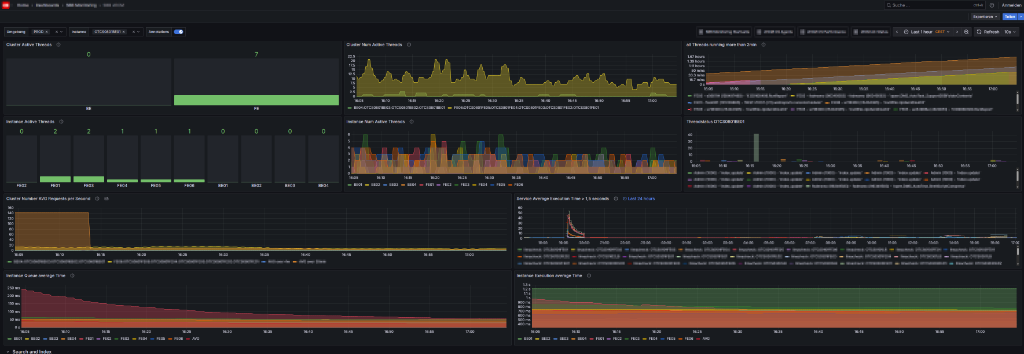
Active Thread Monitoring
Visualize cluster-wide and instance-level active threads to prevent thread starvation.
Execution Time Tracking
Pinpoint slow services with average queue and execution time metrics per instance.
Long-Running Alerts
Instantly spot threads running longer than 2 minutes to identify stuck processes.
The Bottom Line: Instant Responsiveness
When users complain about a 'slow system', thread exhaustion is often the culprit. By tracking thread execution times and active counts, you can pinpoint the exact service causing the slowdown and scale resources before user productivity takes a hit.
Secure Your Archive Center
Your Archive Center is the backbone of long-term compliance. Monitor Windows services, RAM usage, and network traffic to ensure your data is always accessible and secure.
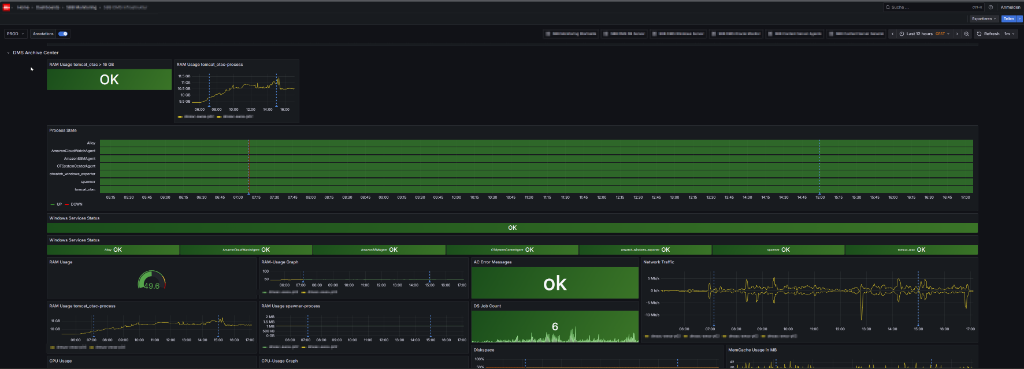
Windows Services Health
Keep an eye on critical Windows services to prevent unexpected downtime of your archiving components.
Resource Utilization
Monitor RAM usage for tomcat and spawner processes to ensure adequate memory allocation.
Traffic & Job Queues
Track network traffic, AD error messages, and DS Job Counts to maintain smooth archiving workflows.
The Bottom Line: Bulletproof Compliance
Archive Centers are highly regulated environments. By proactively monitoring service health and resource usage, you guarantee uninterrupted access to historical records, satisfying both internal users and external auditors.